zig-error-patterns
Some patterns I have started to use when writing zig code with unit tests.
Introduction
Although I try to make good use of the debugger, I am quite used to print-based debugging, especially for unit tests. I wanted to explore some tricks to improve print-based debugging, and also incorporate the debugger more.
print-based debugging improved
One big problem with using print debugging is spammy output. If I am running something in a loop, and only one iteration of the loop has anything interesting, I still need to filter and sort through every iteration's output.
Or perhaps I am working with some data structure that has a printable representation that is easier to parse than the raw data; if I don't know where the error comes from I would have to litter print functions everywhere hoping to catch the necessary context.
However, I realized that since zig tests use errors, instead of panics, it is
possible to use errdefer to print something only when a test actually fails.
test {
    errdefer std.debug.print("{f}", .{ast});
    // ...
}
Does a fantastic job of avoiding cluttering the code, and providing the precise context necessary when an error actually occurs.
Running tests in the debugger
If anything more complex is necessary, using the debugger is the way to go.
However, naively trying to run seergdb or gdb -tui directly from the
terminal gets difficult, as the test binaries are not in zig-out directory
(understandably) but in the zig-cache directory.
I learned a trick from ziggit that the build.zig can run
commands, and you can feed the artifact path of a build step as an argument into
the command:
// seergdb is a gdb gui frontend
const debugger = b.addSystemCommand(&.{ "seergdb", "--run", "--" });
debugger.addArtifactArg(exe_unit_tests);

const debug_step = b.step("debug", "Run unit tests under debugger");
debug_step.dependOn(&debugger.step);
This makes it really easy to run the proper binary; however, this isn't enough on its own: the debugger only kicks into action for a breakpoint or panic, but the test runner gracefully handles errors.
We can get around this by adding @breakpoint calls, but then we are
potentially back to square one, where we have to speculatively add breakpoints
and catch the precise moment where things fail, or have to manually step through
until failure.
Combining tricks
Of course, a good solution is to use:
test {
    errdefer @breakpoint();
}
This will break the program at the precise moment we hit an error. There's a
chance enough context is still around to snoop at with the debugger, and we
would also have the debug printing that the std.testing.expect{.*} functions
provide.
However, this does have downsides. Consider the program:
test "errdefer @breakpoint()" {
    errdefer @breakpoint();
    return error.FixMe;
}

test "normal test" {
    return error.FixMe;
}
If we run zig build test, instead of reporting individual test errors, the
summary will just report that the entire test step failed:
error: while executing test 'main.test.@"errdefer @breakpoint()"',
the following command terminated with signal 5 (expected exited with code 0):

  ./.zig-cache/o/348ca1907303b41ca8e0fceafd43ad63/test \
    --cache-dir=./.zig-cache \
    --seed=0xe3f1cf05 --listen=-
If we still want to preserve the normal behavior except when we actually want to break for a debugger, then we need one more trick.
Conditional compilation
The Zig build system allows us use
build options to pass compile time values to our program. We
can leverage these to pass a bool to decide when to call @breakpoint in
our tests.
Starting from a simple build script that only runs tests:
const std = @import("std");
pub fn build(b: *std.Build) void {
const target = b.standardTargetOptions(.{});
const optimize = b.standardOptimizeOption(.{});
const lib = b.addModule("zig-test-patterns", .{
.root_source_file = b.path("src/root.zig"),
.target = target,
.optimize = optimize,
});
const mod_tests = b.addTest(.{
.root_module = lib,
});
const run_mod_tests = b.addRunArtifact(mod_tests);
const test_step = b.step("test", "Run tests");
test_step.dependOn(&run_mod_tests.step);
}We can add the compile time option like so:
const options = b.addOptions();
options.addOption(bool, "debugger", false);We need to add the generated options module to our lib:
lib.addImport("config", options.createModule());Then, in our root.zig file we can reference the options like so:
const std = @import("std");
const config = @import("config");
test "errdefer @breakpoint()" {
errdefer if (config.debugger) @breakpoint();
return error.FixMe;
}
test "no breakpoint" {
return error.FixMe;
}Now, we can run the test and get no breakpoint:
zig build testHowever, we run into a snag: this value is observable to our program, but
we have to recompile the build.zig in order to change the value. We need
to add the option to the build system itself:
var options = b.addOptions();
const use_debugger = b.option(
bool,
"debugger",
"Enables code intended to only run under a debugger",
) orelse false;
options.addOption(bool, "debugger", use_debugger);Now we can run:
zig build -Ddebugger testAnd observe the change in behavior.
As a final step, we can hook up the command to run our debugger when
the use_debugger flag is set like so:
const test_step = b.step("test", "Run tests");
if (use_debugger) {
const debugger = b.addSystemCommand(&.{ "seergdb", "--run", "--" });
debugger.addArtifactArg(mod_tests);
test_step.dependOn(&debugger.step);
} else {
test_step.dependOn(&run_mod_tests.step);
}Now, if we run with the -Ddebugger flag, the test runner will automatically
run in the debugger, and will break on error! See a screenshot here.
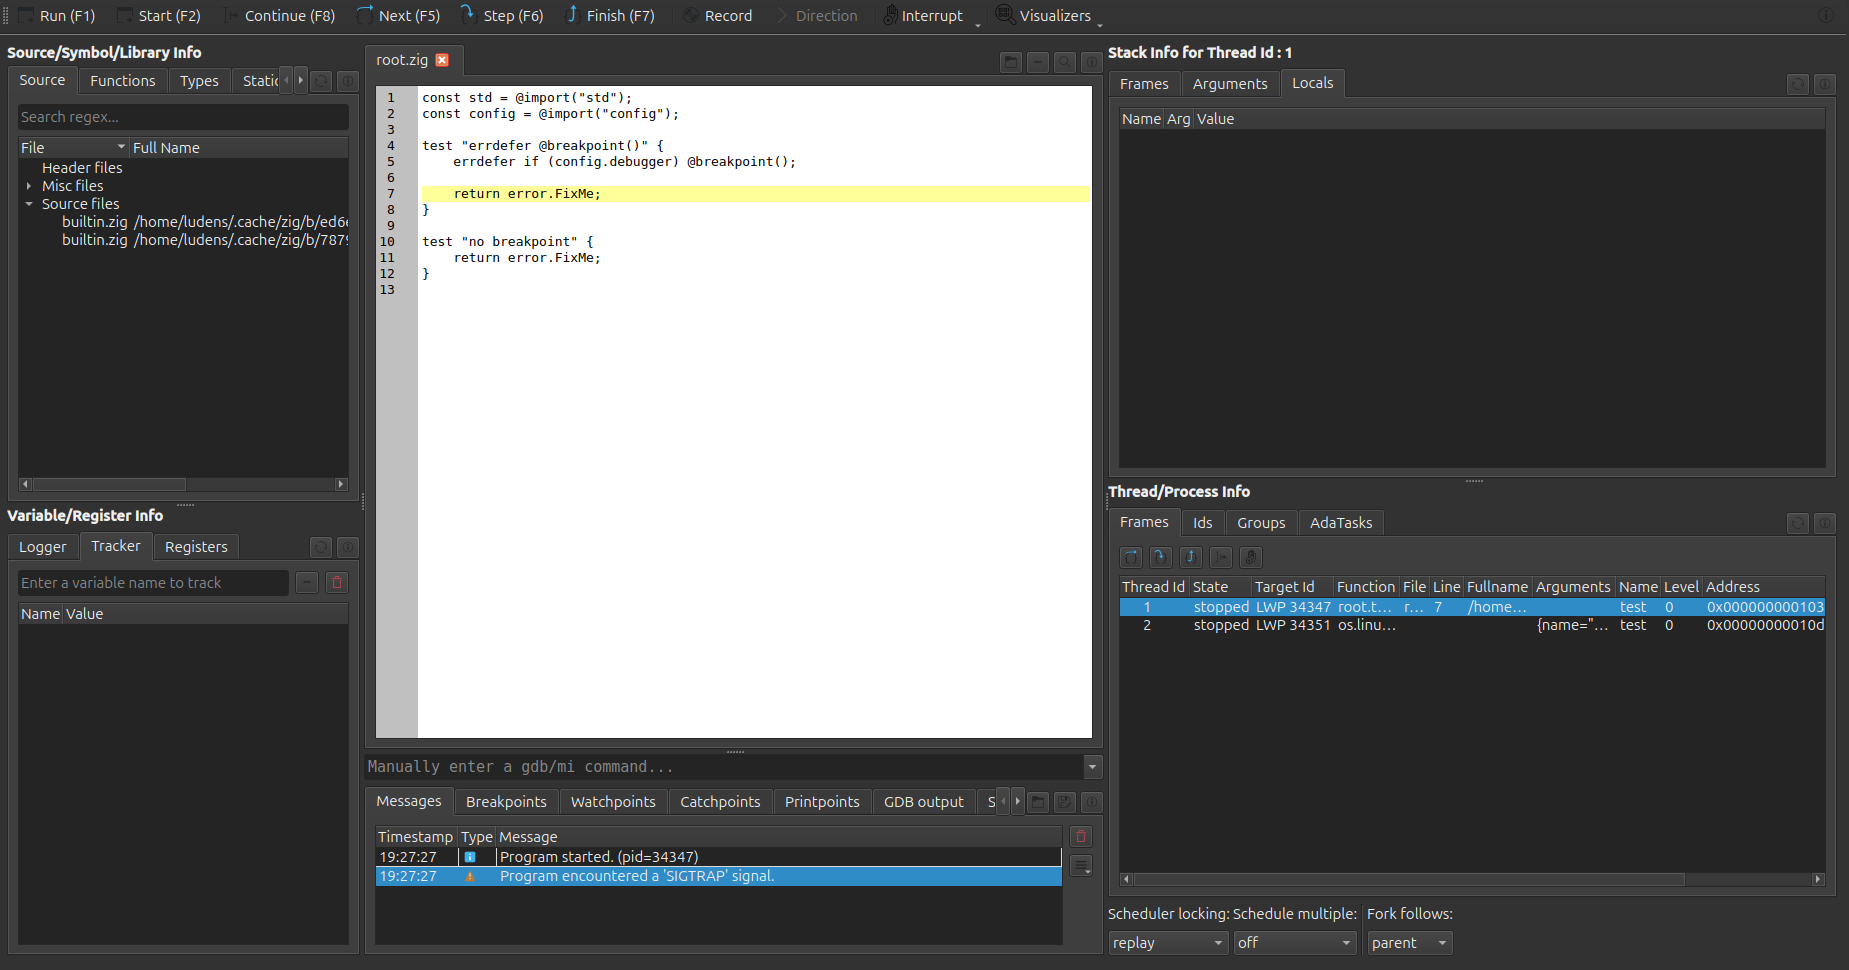
It might be nice to encapsulate the config option checking in a function:
fn breakForDebugger() void {
    if (config.debugger) @breakpoint();
}
But I leave that up to your judgement.
Zig Version
This guide was written with Zig version:
0.15.0-dev.1184+c41ac8f19Also, special thanks to Alanza for reading an early draft of this article.